
Correlating sleep duration and flashcard performance
Since a few years I regularly use Anki, a flashcard system, to memorize and remember information, in particular German words. This daily activity sometimes feels like a breeze and sometimes more like an endless chore. It requires focus, and some day I have the feeling that I’m forgetting words and concepts that normally are a piece of cake. Anki provides reports about the usage, which in my case don’t show any particular pattern (e.g. better accuracy on the weekend or in the evening).
I always had the suspect that sleeping played a role in this. After all, it’s demonstrated that the lack of sleep reduces cognitive abilities, including the declarative memorization, so it seems reasonable to me to expect some correlation between the hours slept in a day and the results in the subsequent Anki session.
In this article I’ll show how I collected this information and examined it.
Tl; dr: I couldn’t find any correlation using my data.
Note: The whole code for this article is freely available on GitHub
Get the activities data
I use an Android device and have a Mi Band 2 bracelet, which has a sleep track functionality. It uses an accelerometer to detect the movements and infer whether the wearer is sleeping (or at least not moving) or not. The app in theory reports the measurement to Google Fit, allowing for an easy check of this data. I say in theory because the Mi Fit app exports this data not as a CSV or similar but only as an image with basic details (!). Besides, the data is not synchronized with Google Fit regularly unless one doesn’t open the app manually every day. To make things worse Google Fit for some reason removed the possibility of checking the dashboard from the web and my Google Takeout export fails upon trying to export this data. I wrote to the support, without results.
So, I used MyActivity instead. This is a service from Google that tracks apps usage, including the Android alarm clock and the phone unlock. Since I put the phone in airplane mode when sleeping and typically check the time and the weather as the first thing in the morning, it should be possible to reconstruct the amount of sleep every day from this.
Google Takeout exports this data as an HTML page, and it’s tens of MB big, enough to break Beautifulsoup.
Luckily, Python provides the html.parser module, which contains HTMLParser. This is a SAX style parser, which means it can process a file as a stream of events, scaling to files of every size.
By implementing the associated handler it’s trivial to extract the timestamp of each activity:
def handle_data(self, data):
  ...
  datetime.strptime(data, '%d.%m.%Y, %H:%M:%S MEZ').astimezone(ZoneInfo("Europe/Berlin"))
  ...
the real code in the repository is a bit more complex because the SAX parser may receive the data in chunks and has to reconstruct the complete string. Notice that since this data is localized the timestamp format and the timezone info need adaptation depending on the language and place.
Once the activities are stored as a comfortable JSONL file with proper ISO timestamps, it’s possible to generate a heatmap of the activities during the average week:
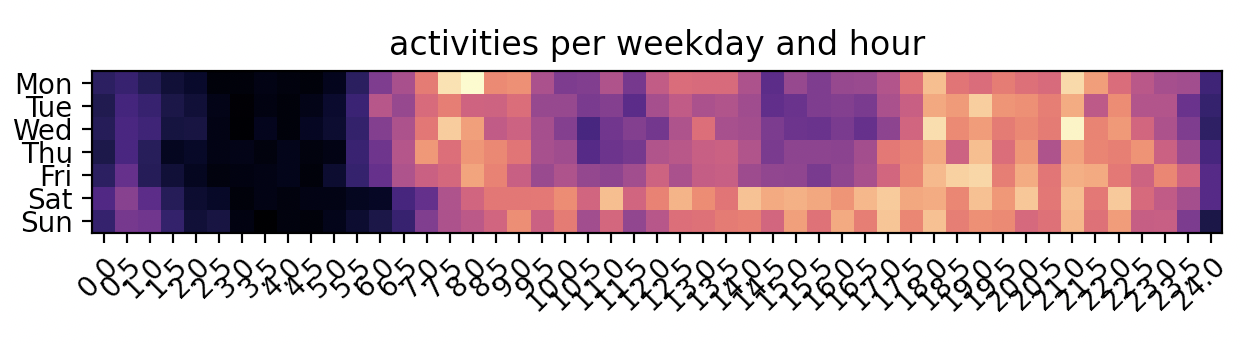
The Activities heatmap shows a spike during the day except lunch time, and more relaxed times during the weekend
Infer sleep from activities
The data is quantized into single hours, so for every day the hours of sleep are stored. An hour is considered a sleep hour if:
- no activities happened in that hour
- it’s greater than 9 and lower than 21 in the local timezone
this is based on my personal sleep habits. A check on the time is necessary to tell apart an hour of sleep from an hour in which I just didn’t touch the phone.
Another detail worth noticing is that in this experiment I considered only the sleep in the previous day, not the cumulative sleep over some larger window. I think it could be a good metric to examine when better data is available.
Get the Anki performance
Anki exports the data in a SQLLite database, from which it’s possible to reconstruct the whole story of each flashcard and its reviews.
The code is accessing this data without any fancy trick, and it ignores cards that are newer than 10 days. My assumption here is that new cards are bound to take some time to be memorized, and would introduce noise in the data.
As a result, we have a daily aggregation of the average ease. The ease is a number between 1 and 5 corresponding to the difficulty buttons presented in Anki.
Correlate the values
At this point, it’s trivial to calculate the Pearson correlation, and chart the aggregated data
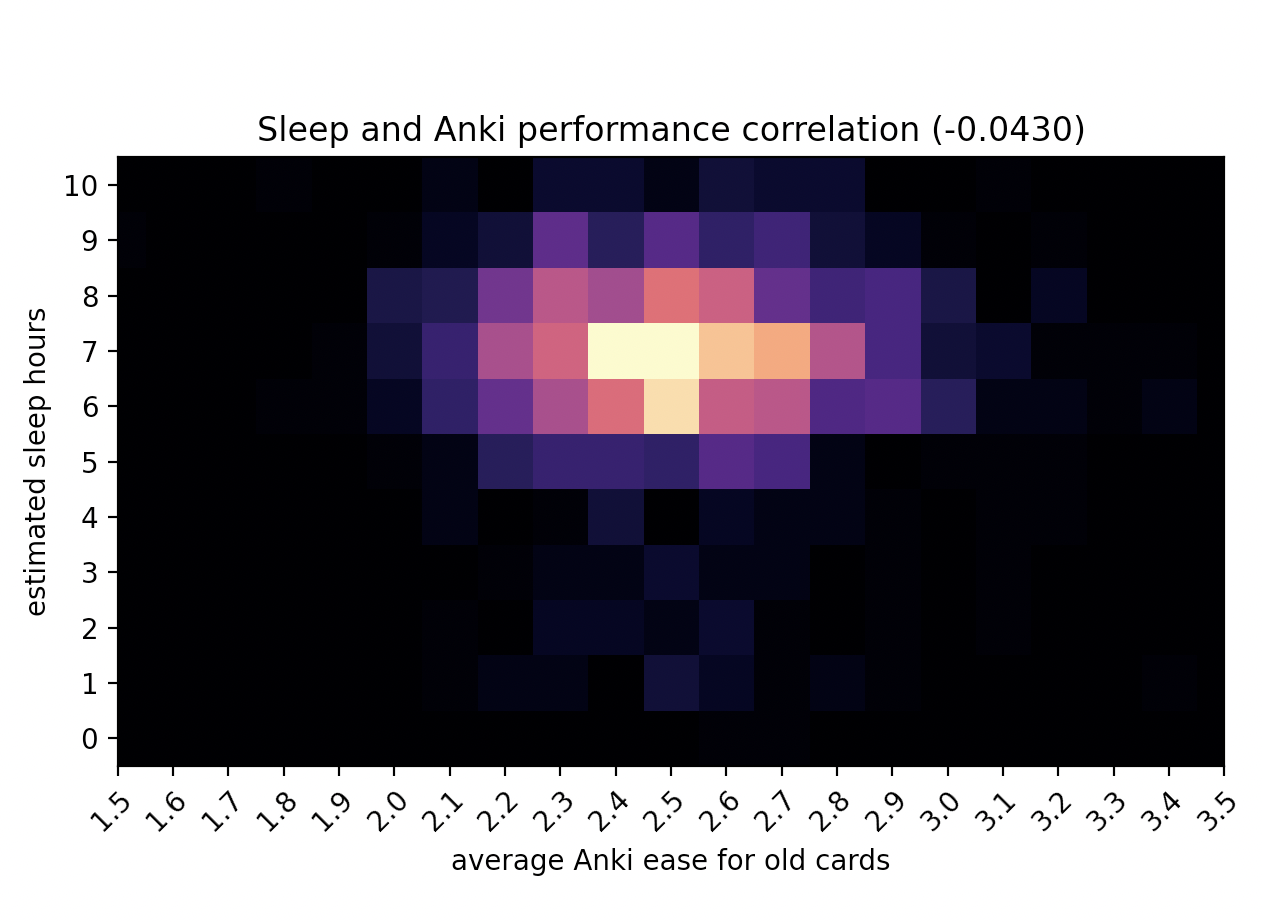
The correlation between number of slept hours and average ease of Anki cards the following day
the Pearson coefficient here is -0.04, which for this level of noise means no correlation. Indeed, it’s even negative!