Some time ago I saw a reddit post on r/milano
presenting a visualization of the nearest Metro or train station in the city of Milan. In short, it
indicates for each station which area is “covered” by it, having it as the closest station.
That visualization uses Voronoi cells built with the Metro stations as the centers, and the distance
metric is then the geodesic distance (“as the crow flies”), but if a station is easy to reach by
tram or, on the other side, is surrounded by railways or highways making crossing difficult this
distance will not represent well how “reachable” the station is by someone walking or using the tram.
I love to go around by bike, and Berlin offers a good choice of paths to explore.
However, after some year in the city I did realize there were areas I never visited and routes I did so often to become boring.
Out of curiosity I tried to process my own location history to map the places I visited more often and, to tell the routine commute habit apart, visualize the time of the day of a visit. The code is on github and of course it’s open source.
After trying regression using k-neighbours, linear and SVR models, I wanted to conclude using neural networks.
I did the 5 deep learning courses from Andrew Ng on Coursera to get a grasp of these models, and decided to use Keras. This library makes defining, training and applying a model quite easy, once one has an idea of what to use.
Artificial neural networks
The naming is suggestive and one may think the goal is to replicate the human brain, but it’s more akin to a generic and very flexible mathematical function.
After trying regression using linear and SVR models, I wanted to try other two methods offered by scikit-learn based on different principles: K nearest neighbor and decision trees.
Nearest Neighbors
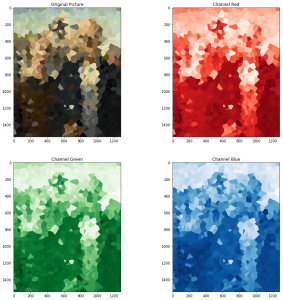
K-nearest neighbor in this case is straightforward, with K=1 transforms the picture in a mosaic (a Voronoi diagram based on the sampled points):
In the previous article we used a linear regression model to predict the color of an image pixel given a sample of other pixels, then used a hand-written function to enrich the coordinates and add non linearity, seeing how it improves the result. Without it, we can only get a gradient image.
I had fun playing with the enrichment function, but scikit-learn offers kernel methods out of the box. It uses a native implementation (libsvm), which is arguably faster than doing it in pure Python.
ConvnetJS offers a demo of a neural network which paints an image learning to predict the color of a pixel given its coordinates. I liked the idea as it is immediate and visually appealing, and decided to create a visual comparison of various supervised learning models applied to this toy problem. In this and further articles will review the results
Given an image with the 3 RGB channels, a train and test dataset can be created just by sampling random pixels. The model can then be applied on all the coordinates to re-generate an approximation of the whole image and see how the model generalizes (or overfits).