
Making a fully static map, part 1: Generate raster tiles from QGIS
In this article we are going to implement an interactive map that can be included in a fully static website.
By fully static I mean that the map does not rely on any external service nor a backend, it is just a bunch of files served directly by nginx (like this blog) or even a CDN. This approach is generally cheaper and simpler to operate, maintain and migrate, without depending on external services whose terms of use may change. It is also extremely flexible in regard of what and how can be displayed and can be ported to non-web apps.
The drawback is that you need to prepare the data in advance for the area you want to display and the map will not be kept up to date automatically.
Such a map can then be used to visualize data, overlaying a choropleth map or something fancy like the location data heatmap. My personal use case is to display data from Milan open data, but the process described here can reasonably scale to larger areas. Another advantage is that it’s possible with minimal effort to generate historical maps representing the state of OpenStreetMap data at a past point in time.
This article will show how to do that using QGIS and generating raster tiles, in further articles I’ll discuss other approaches like vector tiles.
The process
The basic idea is to render the geographical data from the map into static PNG images, arranged in a folder structure that makes it possible from the front end to retrieve them at the desired level of zoom and coordinates. These images are called tiles.
The process is as follow:
- retrieve the raw data from OpenStreetMap
- convert the PBF file in a SpatiaLite database
- import the database in QGIS
- customize the look of the map
- generate the static map tiles
- add a client-side renderer
it may sound complicated, but it’s fairly simple and well documented.
Retrieve the raw data from OpenStreetMap
IMPORTANT NOTE: OpenStreetMap is free but you are still required to credit derivative work like this. As we’ll see, doing so is trivial.
OpenStreetMap allows to download a snapshot of the whole planet, and at the same page you can find services like Geofabrik that kindly offer small extracts of specific regions, which is likely what you need.
These files usually have extension PBF which stands for Protobuf. You don’t need to know these details to deal with it, just be aware it’s a binary format and it’s very compact and fast to read. It contains all the geometries and tags in the map, plus some metadata about when the data was created. Notice that the PBF file is not exactly raw Protobuf but rather a container format that includes Protobuf data, so it cannot be directly handled and inspected with tools like protoc.
If you desire, there is a tool called Osmium that allows to cut and merge these files. It’s a Swiss army knife to process this raw data efficiently, and one very intriguing functionality is that it’s possible to process historical exports to retrieve the state of the map at a given point in time.
Selecting the area at this stage is the fastest option, but it’s possible to import everything and generate the tiles for a smaller area at a later stage.
In my case, I downloaded from openstreetmap.fr the extract for Lombardia (the region of Italy containing Milan), and used this command:
osmium extract -b 9.35,45.38,9.02,45.55 lombardia-latest.osm.pbf -o milano.pbf
obtaining a file of 25 MB from the original 250 MB, based on a bounding box. It’s also possible to select a more refined area based on a GeoJSON polygon
Convert the PBF file in a SpatiaLite database
Now we have a file containing the raw data, but to make use of it we need to import it into a database, because the PBF format is designed to be a compact representation useful to exchange data, not to process it.
In my previous article about 3D rendering I used PostGIS and Flex, but here we need the database only as an intermediate step and don’t really plan to process or upgrade this data, so I think SpatiaLite is much more convenient. This is a geographical extension of SQLLite (essentially is for SQLLite what PostGIS is for Postgres), and the result is a single file ready to use.
Using ogr2ogr the conversion is a breeze:
ogr2ogr -f "SQLite" -dsco SPATIALITE=YES milano.db milano.pbf
in 10 seconds on my machine a database file is created, it is about 6 times bigger than the PBF file because it contains indexes and is designed for direct usage.
If you, like me, are curious, you can open it with any SQLLite client and peek inside, without using the SpatiaLite functions. Geometries are stored in a format similar to WKB, but not identical.
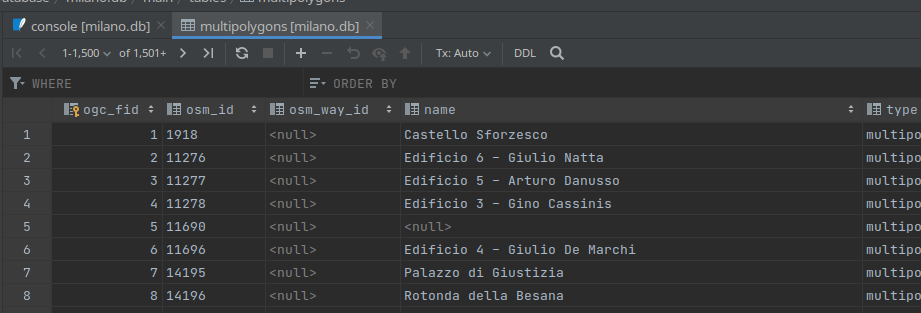
A SpatiaLite table opened in DataGrip as a plain SQLLite file
Additionally, you can use the spatial functionalities from Python by enabling the SpatiaLite extension and access it programmatically.
Import the database in QGIS
Now that we have a SpatiaLite export containing our geometries, a tool like QGIS makes it possible to explore the data. Just add the SpatiaLite database to the project
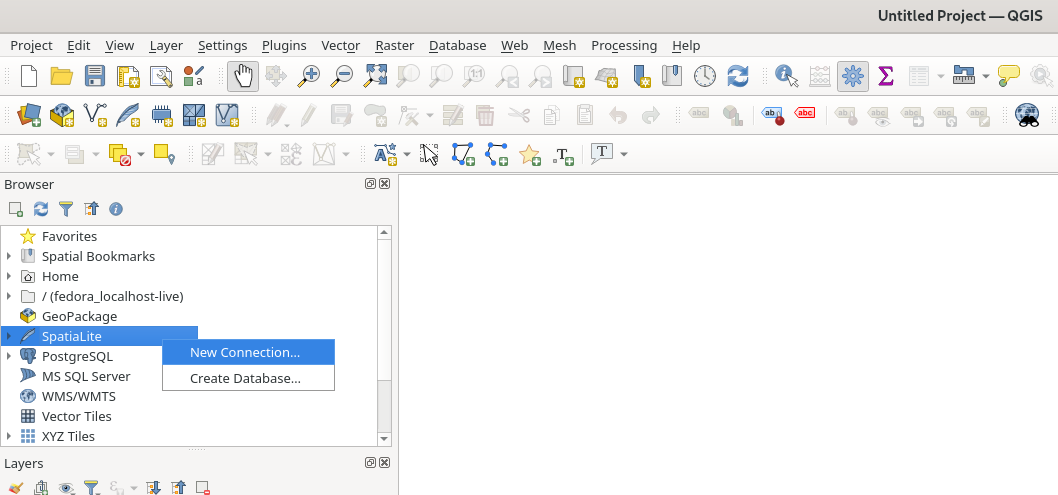
Importing a Spatialite database into QGIS is trivial
If you never used it, it’s worth have a look at QGIS functionalities. In short, it does pretty much everything you may need related to geographical data. You can merge data from different sources and formats, query for specific features, run analysis and much more.
Right now, we only want to see the map.
Once connected to the database, QGIS will detect it contains a few geometries, namely lines, multilinestrings, points and multipolygons. Unlike when we used pgosm-flex here the data is kept very close to the original format, and as such it contains pure geometries, without distinction between roads, buildings, waterways and so on.
Dragging the geometries into the layers panel will produce something like this:
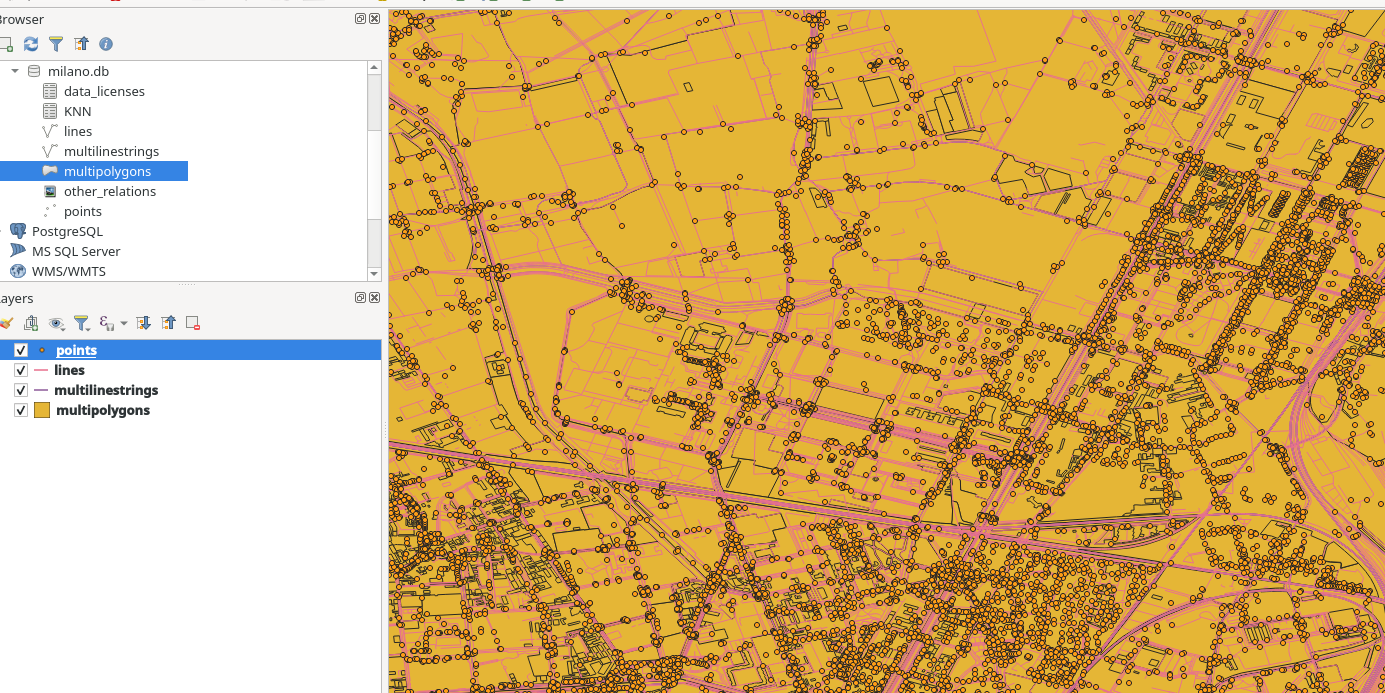
How QGIS displays raw geometries
notice that you may need to rearrange the order of layers to see all of them (by default the first layers can cover the others).
Customize the look of the map
Right now, QGIS can only show the raw geometries. It knows that there is, say, a polygon and where it is, but not that it’s a park or a river. On the top bar there’s the icon of an Identify feature tool, by using it (note that you need to select the layer too) you will find that geometries have features like names, amenity, phone numbers and so on, but the program has no clue about how to use them to better display the map.
This is enough to give us an idea of what the data looks like, but it’s not what we want. We need to hide details that are not relevant to us, show labels with the names of streets and zones, and assign colors based on the OSM tags (rivers are blue, parks are green, etc.).
Double-clicking on a layers shows its option, and in particular the Symbology and Label panels are where we can set rules to choose exactly how to render (or not render) every element based on tags.
This allows us to customize the look of the map in detail, but it takes time. You can instead import a style already made by the American Red Cross, by clicking on the Style button at the bottom of the properties window.
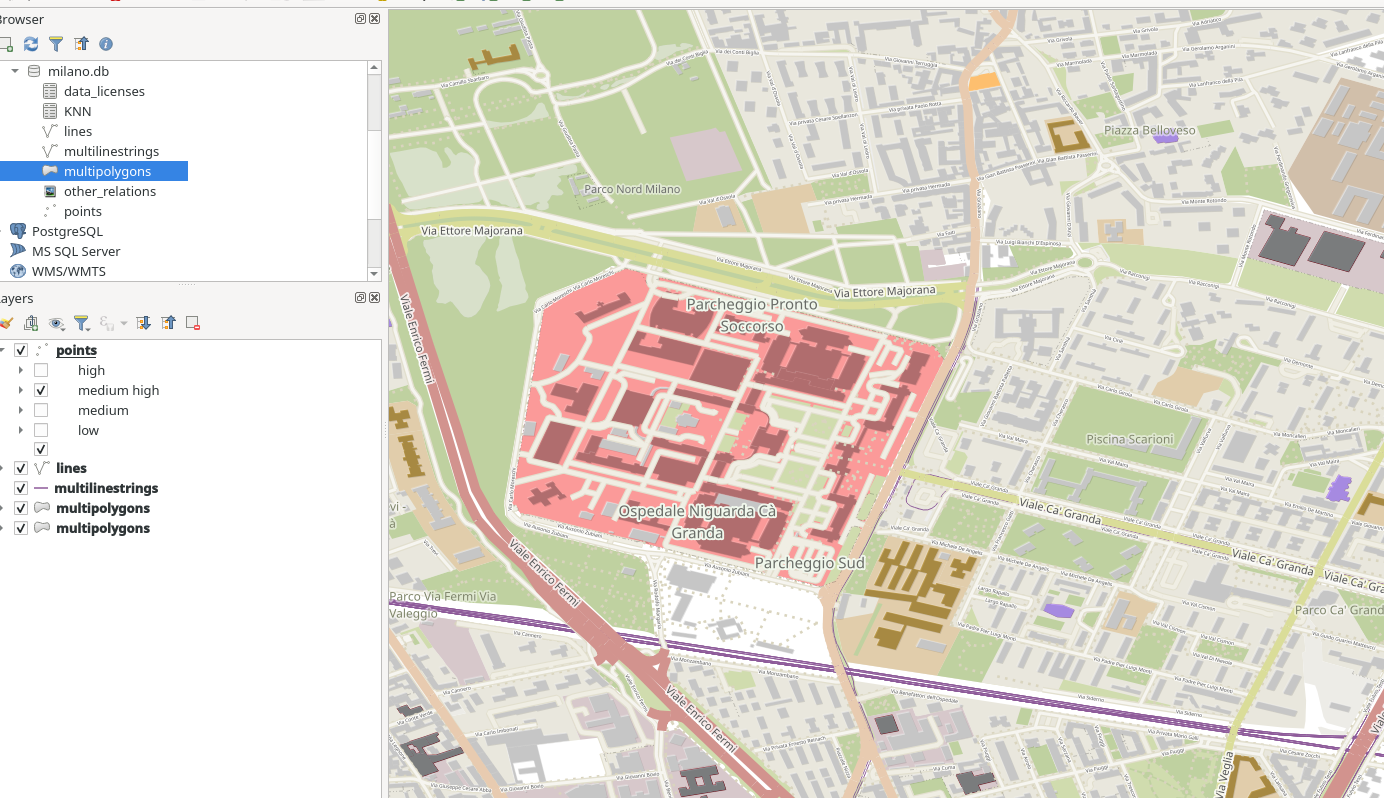
The American Red Cross style applied to the same map
some styles, like the buildings and polygons, use the same layer, so you have to duplicate it or they’ll overwrite each other.
The map looks much nicer and clearer now, and the style can be further customized and exported. QGIS also has a style manager to reuse styles across projects.
Have fun, you can explore the map and change the style at will!
Generate the static map tiles
Now that QGIS can display the data, we need to export it in a format suitable for the browser. For that, go to Processing -> Toolbox... -> Raster tools -> Generate XYZ tiles (Directory).
What this tool does is to generate PNG images for squares of the map called tiles, arranged in subfolders for different zoom levels.
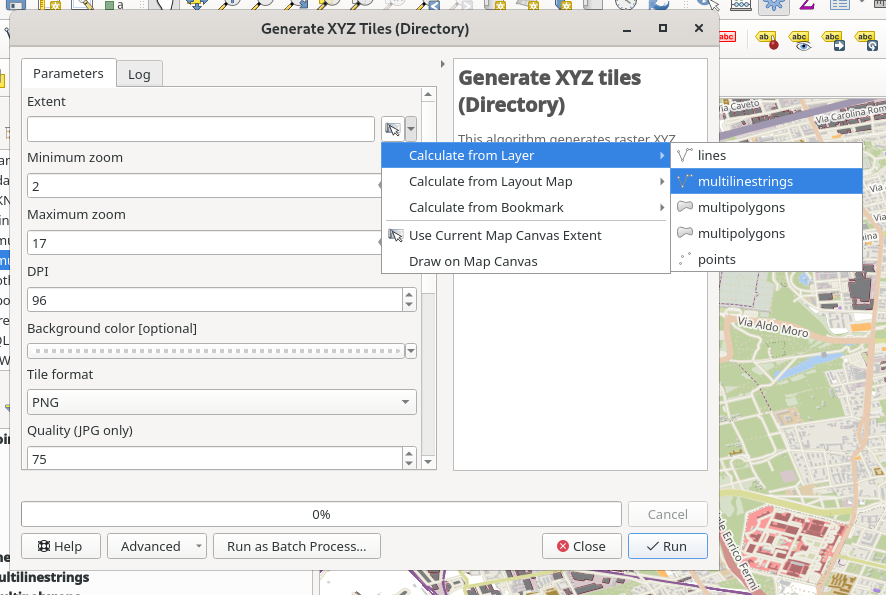
Exporting raster tiles to a directory with the toolbox
The zoom level is the same number you see in the URL of OpenStreetMap (or other map applications), roughly speaking each level doubles the zoom, 0 means the whole world and 19 is enough to see details of a building and specific elements like fountains or trash bins.
Since each zoom level doubles the resolution, each take 4 times more disk space than the previous one (4 times because it doubles both in width and height), and time to process.
To give you an idea of what to expect, these are the numbers for the city of Milan, Italy:
- PBF extract: 25 MB
- SpatiaLite file: 159 MB
- size of PNG raster at zoom level 17: 1.8 GB
- size of all zoom levels (2-7) combined: 3.6 GB
- time to produce all the images: 25 minutes
the size and time scale linearly with the amount of details in the extent, and exponentially with the maximum zoom.
Add a client-side renderer
In the options of the Generate XYZ tiles (Directory) you probably noticed a Output HTML (Leaflet) entry. By selecting it, an HTML file will be created, already configured to display the map.
The file imports the Leaflet JS library from a CDN and uses it to read from the directories with the generated tiles.
Notice that by default QGIS generates a file:// path, and you need to change it to the address of your website (or a relative path) to make it work once published.
In the file there’s also an attribution field. You have to change the content to:
©<a href="https://www.openstreetmap.org/copyright">OpenStreetMap contributors</a>
to comply with the OSM copyright.
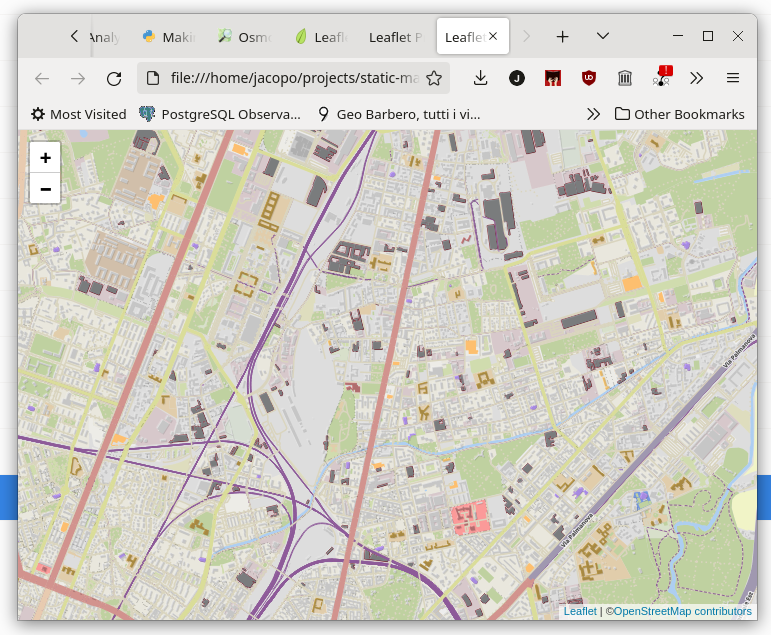
The end result, an interactive map that requires no backend to be served
The Leaflet library is quite an amazing software, even more if we consider that the creator is from Kyiv and made the release 1.8 while the city was being attacked by Russia. You can use it to add multiple layers, to display GeoJSON or react to user clicks and create complex visualizations.
Conclusion
I hope this article was useful, this technique is quite simple but there are improvements to be done. Namely, we can use vector tiles and accelerate the rendering with WebGL, topics that I plan to cover later in more articles.